Stat-Ease Blog

Categories
The Importance of Center Points in Central Composite Designs
A central composite design (CCD) is a type of response surface design that will give you very good predictions in the middle of the design space. Many people ask how many center points (CPs) they need to put into a CCD. The number of CPs chosen (typically 5 or 6) influences how the design functions.
Two things need to be considered when choosing the number of CPs in a central composite design:
1) Replicated center points are used to estimate pure error for the lack of fit test. Lack of fit indicates how well the model you have chosen fits the data. With fewer than five or six replicates, the lack of fit test has very low power. You can compare the critical F-values (with a 5% risk level) for a three-factor CCD with 6 center points, versus a design with 3 center points. The 6 center point design will require a critical F-value for lack of fit of 5.05, while the 3 center point design uses a critical F-value of 19.30. This means that the design with only 3 center points is less likely to show a significant lack of fit, even if it is there, making the test almost meaningless.
TIP: True “replicates” are runs that are performed at random intervals during the experiment. It is very important that they capture the true normal process variation! Do not run all the center points grouped together as then most likely their variation will underestimate the real process variation.
2) The default number of center points provides near uniform precision designs. This means that the prediction error inside a sphere that has a radius equal to the ±1 levels is nearly uniform. Thus, your predictions in this region (±1) are equally good. Too few center points inflate the error in the region you are most interested in. This effect (a “bump” in the middle of the graph) can be seen by viewing the standard error plot, as shown in Figures 1 & 2 below. (To see this graph, click on Design Evaluation, Graph and then View, 3D Surface after setting up a design.)
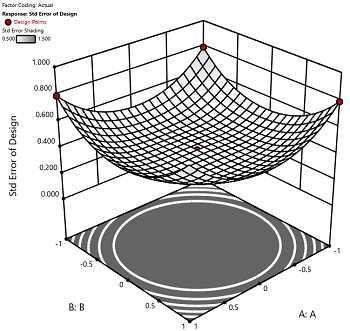
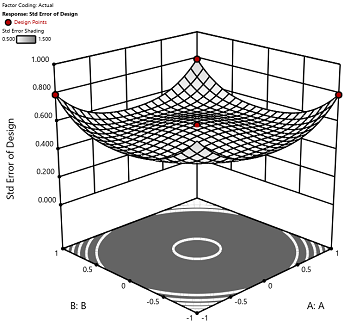
Figure 1 (left): CCD with the 6 center points (5-6 recommended). Figure 2 (right): CCD with only 3 center points. Notice the jump in standard error at the center of figure 2.
Ask yourself this—where do you want the best predictions? Most likely at the middle of the design space. Reducing the number of center points away from the default will substantially damage the prediction capability here! Although it can seem tedious to run all of these replicates, the number of center points does ensure that the analysis of the design can be done well, and that the design is statistically sound.
Augmenting One-Factor-at-a-Time Data to Build a DOE
I am often asked if the results from one-factor-at-a-time (OFAT) studies can be used as a basis for a designed experiment. They can! This augmentation starts by picturing how the current data is laid out, and then adding runs to fill out either a factorial or response surface design space.
One way of testing multiple factors is to choose a starting point and then change the factor level in the direction of interest (Figure 1 – green dots). This is often done one variable at a time “to keep things simple”. This data can confirm an improvement in the response when any of the factors are changed individually. However, it does not tell you if making changes to multiple factors at the same time will improve the response due to synergistic interactions. With today’s complex processes, the one-factor-at-a-time experiment is likely to provide insufficient information.
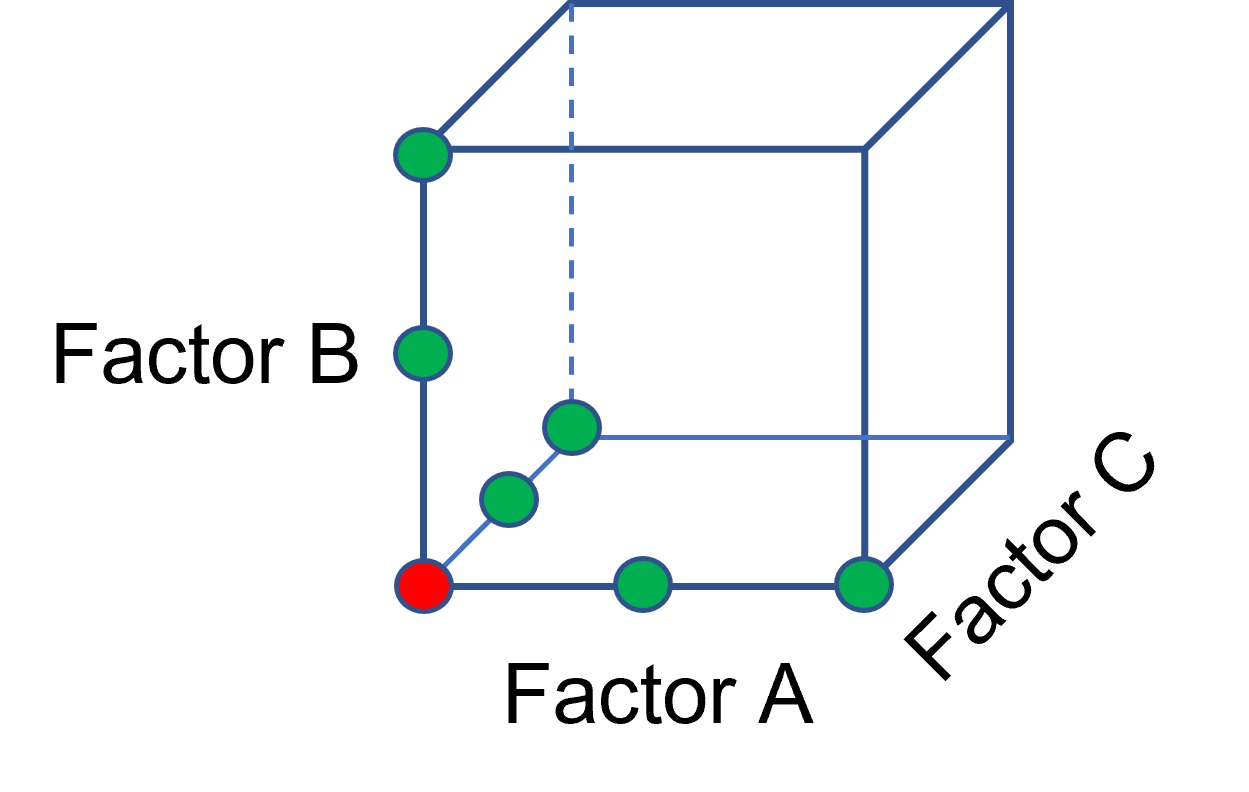
Figure 1: OFAT
The experimenter can augment the existing data by extending a factorial box/cube from the OFAT runs and completing the design by running the corner combinations of the factor levels (Figure 2 – blue dots). When analyzing this data together, the interactions become clear, and the design space is more fully explored.
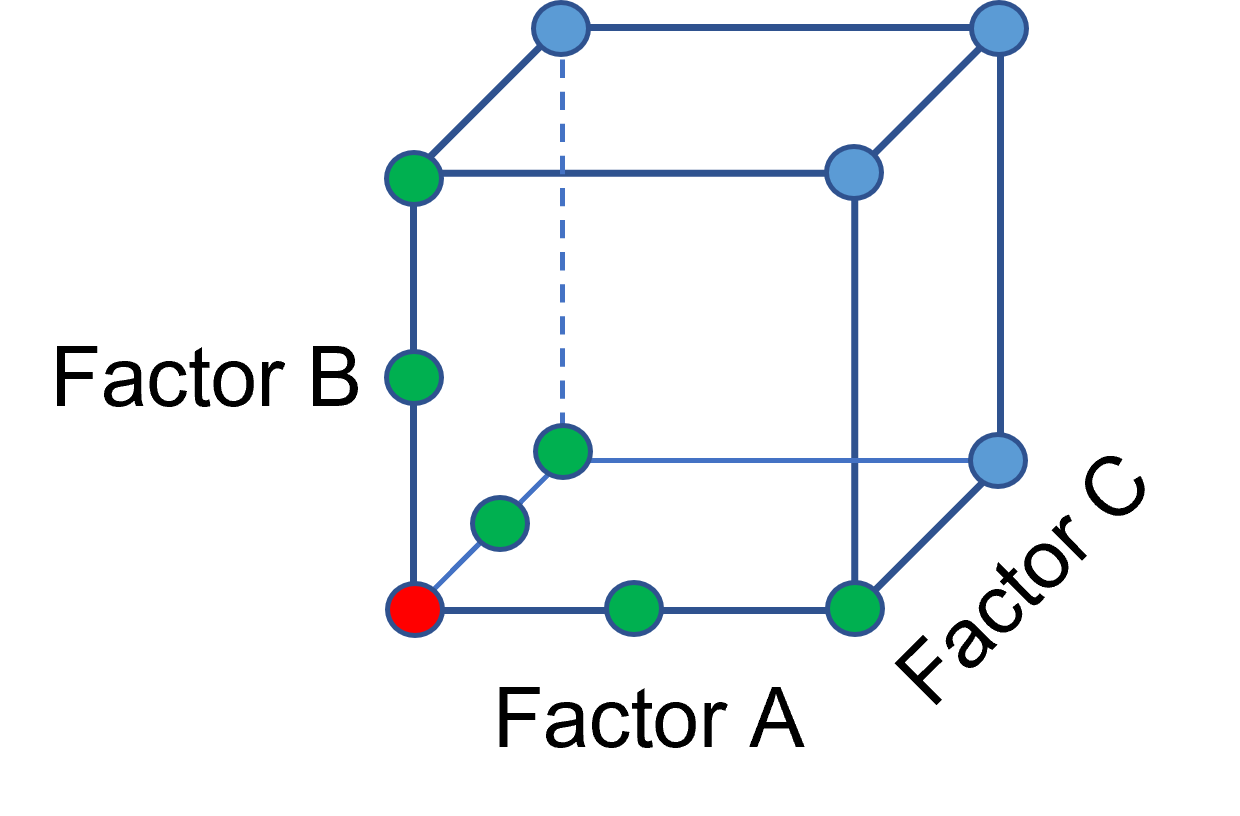
Figure 2: Fill out to factorial region
In other cases, OFAT studies may be done by taking a standard process condition as a starting point and then testing factors at new levels both lower and higher than the standard condition (see Figure 3). This data can estimate linear and nonlinear effects of changing each factor individually. Again, it cannot estimate any interactions between the factors. This means that if the process optimum is anywhere other than exactly on the lines, it cannot be predicted. Data that more fully covers the design space is required.
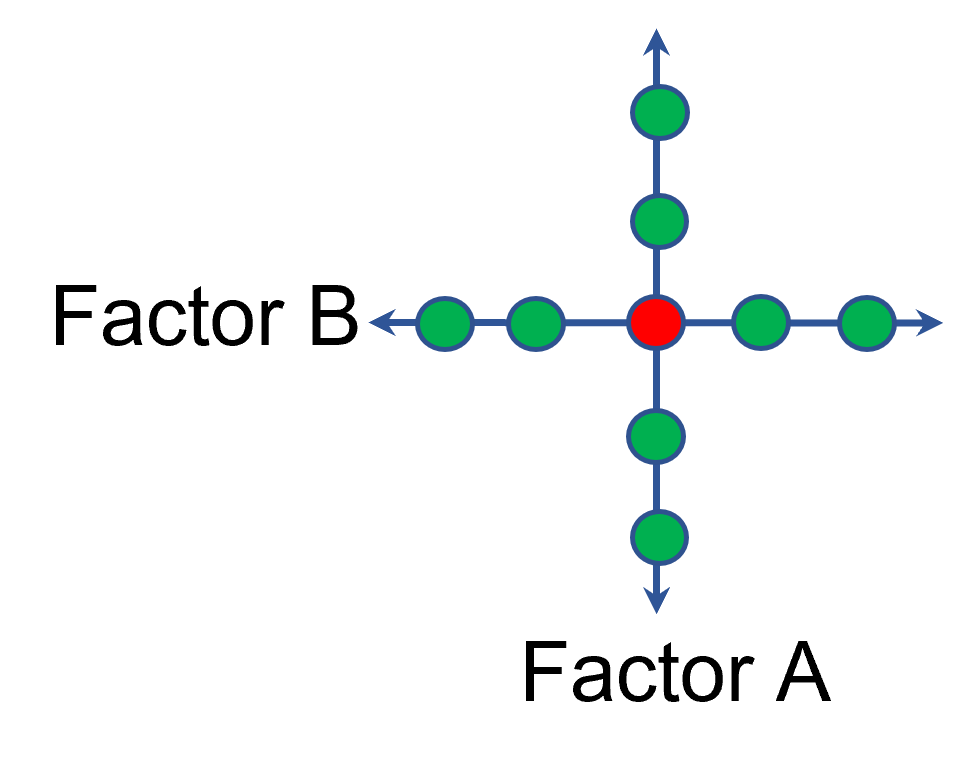
Figure 3: OFAT
A face-centered central composite design (CCD)—a response surface method (RSM)—has factorial (corner) points that define the region of interest (see Figure 4 – added blue dots). These points are used to estimate the linear and the interaction effects for the factors. The center point and mid points of the edges are used to estimate nonlinear (squared) terms.
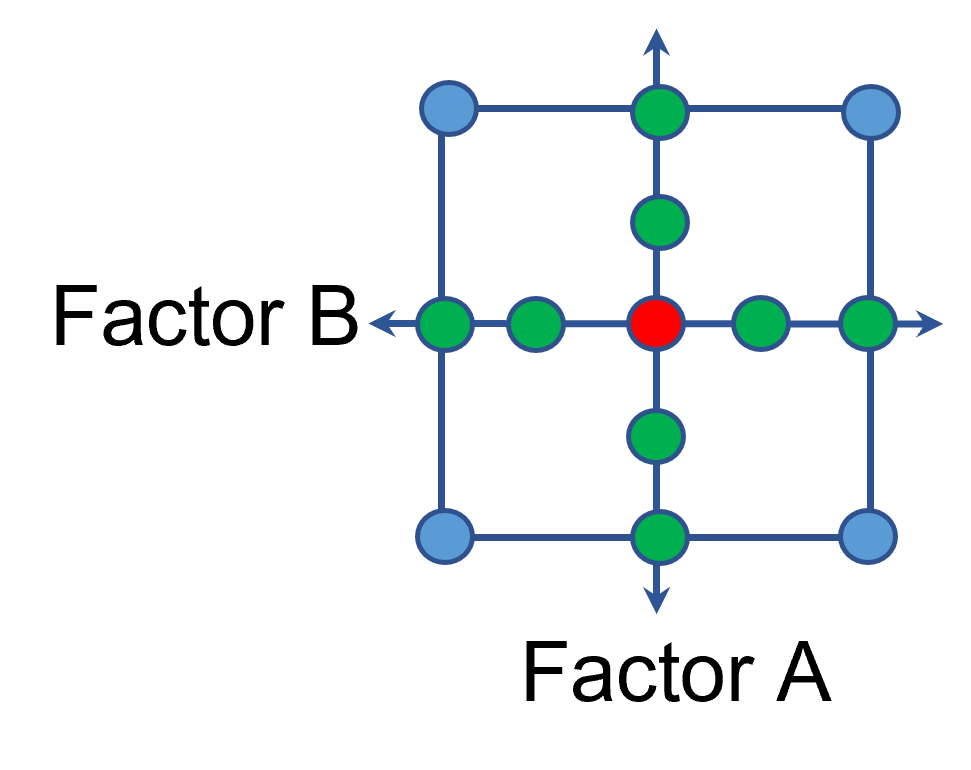
Figure 4: Face-Centered CCD
If an experimenter has completed the OFAT portion of the design, they can augment the existing data by adding the corner points and then analyzing as a full response surface design. This set of data can now estimate up to the full quadratic polynomial. There will likely be extra points from the original OFAT runs, which although not needed for model estimation, do help reduce the standard error of the predictions.
Running a statistically designed experiment from the start will reduce the overall experimental resources. But it is good to recognize that existing data can be augmented to gain valuable insights!
Learn more about design augmentation at the January webinar: The Art of Augmentation – Adding Runs to Existing Designs.
Blocking: Mowing the Grass in Your Experimental Backyard
One challenge of running experiments is controlling the variation from process, sampling and measurement. Blocking is a statistical tool used to remove the variation coming from uncontrolled variables that are not part of the experiment. When the noise is reduced, the primary factor effects are estimated more easily, which allows the system to be modeled more precisely.
For example, an experiment may contain too many runs to be completed in just one day. However, the process may not operate identically from one day to the next, causing an unknown amount of variation to be added to the experimental data. By blocking on the days, the day-to-day variation is removed from the data before the factor effects are calculated. Other typical blocking variables are raw material batches (lots), multiple “identical” machines or test equipment, people doing the testing, etc. In each case the blocking variable is simply a resource required to run the experiment-- not a factor of interest.
Blocking is the process of statistically splitting the runs into smaller groups. The researcher might assume that arranging runs into groups randomly is ideal - we all learn that random order is best! However, this is not true when the goal is to statistically assess the variation between groups of runs, and then calculate clean factor effects. Design-Expert® software splits the runs into groups using statistical properties such as orthogonality and aliasing. For example, a two-level factorial design will be split into blocks using the same optimal technique used for creating fractional factorials. The design is broken into parts by using the coded pattern of the high-order interactions. If there are 5 factors, the ABCDE term can be used. All the runs with “-” levels of ABCDE are put in the first block, and the runs with “+“ levels of ABCDE are put in the second block. Similarly, response surface designs are also blocked statistically so that the factor effects can be estimated as cleanly as possible.
Blocks are not “free”. One degree of freedom (df) is used for each additional block. If there are no replicates in the design, such as a standard factorial design, then a model term may be sacrificed to filter out block-by-block variation. Usually these are high-order interactions, making the “cost” minimal.
After the experiment is completed, the data analysis begins. The first line in the analysis of variance (ANOVA) will be a Block sum of squares. This is the amount of variation in the data that is due to the block-to-block differences. This noise is removed from the total sum of squares before any other effects are calculated. Note: Since blocking is a restriction on the randomization of the runs, this violates one of the ANOVA assumptions (independent residuals) and no F-test for statistical significance is done. Once the block variation is removed, the model terms can be tested against a smaller residual error. This allows factor effects to stand out more, strengthening their statistical significance.
Example showing the advantage of blocking:
In this example, a 16-blend mixture experiment aimed at fitting a special-cubic model is completed over 2 days. The formulators expect appreciable day-to-day variation. Therefore, they build a 16-run blocked design (8-runs per day). Here is the ANOVA:
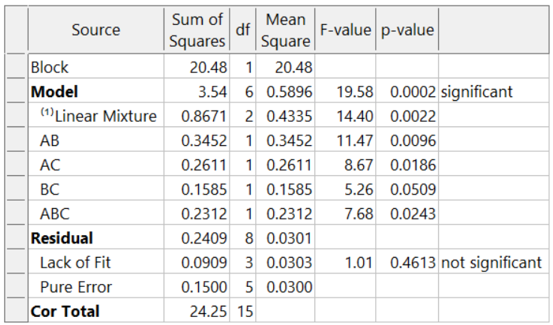
The adjusted R² = 0.8884 and the predicted R² = 0.7425. Due to the blocking, the day-to-day variation (sum of squares of 20.48) is removed. This increases the sensitivity of the remaining tests, resulting in an outstanding predictive model!
What if these formulators had not thought of blocking and, instead, simply, run the experiment in a completely randomized order over two days? The ANOVA (again for the designed-for special-cubic mixture model) now looks like this:
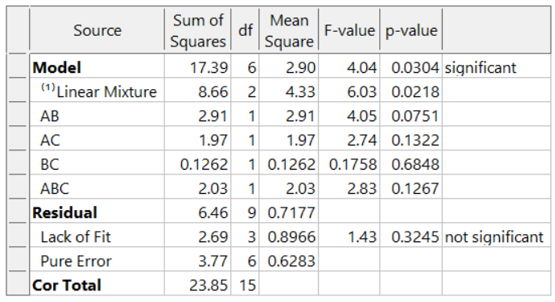
The model is greatly degraded, with adjusted R² = 0.5487, and predicted R² = 0.0819 and includes many insignificant terms. While the blocked model shown above explains 74% of the variation in predictions (the predicted R-Square), the unblocked model explains only 8% of the variation in predictions, leaving 92% unexplained. Due to the randomization of the runs, the day-to-day variation pollutes all the effects, thus reducing the prediction ability of the model.
Conclusion:
Blocks are like an insurance policy – they cost a little, and often aren’t required. However, when they are needed (block differences large) they can be immensely helpful for sorting out the real effects and making better predictions. Now that you know about blocking, consider whether it is needed to make the most of your next experiment.
Blocking FAQs:
How many runs should be in a block?
My rule-of-thumb is that a block should have at least 4 runs. If the block size is smaller, then don’t use blocking. In that case, the variable is simply another source of variation in the process.
Can I block a design after I’ve run it?
You cannot statistically add blocks to a design after it is completed. This must be planned into the design at the building stage. However, Design-Expert has sophisticated analysis tools and can analyze a block effect even if it was not done perfectly (added to the design after running the experiment). In this case, use Design Evaluation to check the aliasing with the blocks, watching for main effects or two-factor interactions (2FI).
Are there any assumptions being made about the blocks?
There is an assumption that the difference between the blocks is a simple linear shift in the data, and that this variable does not interact with any other variable.
I want to restrict the randomization of my factor because it is hard to change the setting with every run. Can I use blocking to do this?
No! Only block on variables that you are not studying. If you need to restrict the randomization of a factor, consider using a split-plot design.
What’s Behind Aliasing in Fractional-Factorial Designs
Aliasing in a fractional-factorial design means that it is not possible to estimate all effects because the experimental matrix has fewer unique combinations than a full-factorial design. The alias structure defines how effects are combined. When the researcher understands the basics of aliasing, they can better select a design that meets their experimental objectives.
Starting with a layman’s definition of an alias, it is 2 or more names for one thing. Referring to a person, it could be “Fred, also known as (aliased) George”. There is only one person, but they go by two names. As will be shown shortly, in a fractional-factorial design there will be one calculated effect estimate that is assigned multiple names (aliases).
This example (Figure 1) is a 2^3, 8-run factorial design. These 8 runs can be used to estimate all possible factor effects including the main effects A, B, C, followed by the interaction effects AB, AB, BC and ABC. An additional column “I” is the Identity column, representing the intercept for the polynomial.
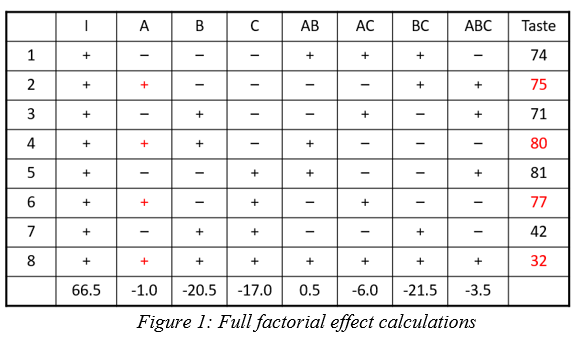
Each column in the full factorial design is a unique set of pluses and minuses, resulting in independent estimates of the factor effects. An effect is calculated by averaging the response values where the factor is set high (+) and subtracting the average response from the rows where the term is set low (-). Mathematically this is written as follows:
In this example the A effect is calculated like this:
The last row in figure 1 shows the calculation result for the other main effects, 2-factor and 3-factor interactions and the Identity column.
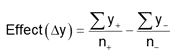
In a half-fraction design (Figure 2), only half of the runs are completed. According to standard practice, we eliminate all the runs where the ABC column has a negative sign. Now the columns are not unique – pairs of columns have the identical pattern of pluses and minuses. The effect estimates are confounded (aliased) because they are changing in exactly the same pattern. The A column is the same pattern as the BC column (A=BC). Likewise, B=AC and C=AB. Finally, I=ABC. These paired columns are said to be “aliased” with each other.
In the half-fraction, the effect of A (and likewise BC) is calculated like this:
When the effect calculations are done on the half-fraction, one mathematical calculation represents each pair of terms. They are no longer unique. Software may label the pair only by the first term name, but the effect is really all the real effects combined. The alias structure is written as:
I = ABC
[A] = A+BC
[B] = B+AC
[C] = C+AB
Looking back at the original data, the A effect was -1 and the BC effect was -21.5. When the design is cut in half and the aliasing formed, the new combined effect is:
A+BC = -1 + (-21.5) = -22.5
The aliased effect is the linear combination of the real effects in the system. Aliasing of main effects with two-factor interactions (2FI) is problematic because 2FI’s are fairly likely to be significant in today’s complex systems. If a 2FI is physically present in the system under study, it will bias the main effect calculation. Any system that involves temperature, for instance, is extremely likely to have interactions of other factors with temperature. Therefore, it would be critical to use a design table that has the main effect calculations separated (not aliased) from the 2FI calculations.
What type of fractional-factorial designs are “safe” to use? It depends on the purpose of the experiment. Screening designs are generally run to correctly identify significant main effects. In order to make sure that those main effects are correct (not biased by hidden 2FI’s), the aliasing of the main effects must be with three-factor interactions (3FI) or greater. The alias structure looks something like this (only main effect aliasing shown):
I = ABCD
[A] = A+BCD
[B] = B+ACD
[C] = C+ABD
[D] = D+ABC
If the experimental goal is characterization or optimization, then the aliasing pattern should ensure that both main effects and 2FI’s can be estimated well. These terms should not be aliased with other 2FI’s.
Within Design-Expert or Stat-Ease 360 software, color-coding on the factorial design selection screen provides a visual signal. Here is a guide to the colors, listed from most information to least information:
- White squares – full factorial designs (no aliasing)
- Green squares – good estimates of both main effects and 2FI’s
- Yellow squares – good estimates of main effects, unbiased from 2FI’s in the system
- Red squares – all main effects are biased by any existing 2FI’s (not a good design to properly identify effects, but acceptable to use for process validation where it is assumed there are no effects).
This article was created to provide a brief introduction to the concept of aliasing. To learn more about this topic and how to take advantage of the efficiencies of fractional-factorial designs, enroll in the free eLearning course: How to Save Runs with Fractional-Factorial Designs.
Good luck with your DOE data analysis!
Experimental Design in Chemistry: A Review of Pitfalls (Guest Post)
This blog post is from James Cawse, Consultant and Principal at Cawse and Effect, LLC. Jim uses his unique blend of chemical knowledge, statistical skills, industrial process experience, and quality commitment to find solutions for his client's difficult experimental and process problems. He received his Ph.D. in Organic Chemistry from Stanford University. On top of all that, he's a great guy! Visit his website (link above) to find out more about Jim, his background, and his company.
Introduction
Getting the best information from chemical experimentation using design of experiments (DOE) is a concept that has been around for decades, although it is still painfully underused in chemistry. In a recent article Leardi1 pointed this out with an excellent tutorial on basic DOE for chemistry. The classic DOE text Statistics for Experimenters2 also used many chemical illustrations of DOE methodology. In my consulting practice, however, I have encountered numerous situations where ’vanilla‘ DOE – whether from a book, software, or a Six Sigma course – struggles mightily because of the inherent complications of chemistry.The basic rationale for using a statistically based DOE in any science are straightforward. The DOE method provides:
- Points distributed in a rational fashion throughout “experimental space”.
- Noise reduction by averaging and application of efficient statistical tools.
- ‘Synergy’, typically the result of the interactions of two or more factors - easily determined in a DOE.
- An equation (model) that can then be used to predict further results and optimize the system.
DOE works so well in most scientific disciplines because Mother Nature is kind. In general:
- Most experiments can be performed with small numbers of ’well behaved‘ factors, typically simple numeric or qualitative at 2-3 levels
- Interactions typically involve only 2 factors. Three level and higher interactions are ignored.
- The experimental space is relatively smooth; there are no cliffs (e.g. phase changes).
Y = B0 + B1x1 + B2x2 + B12x1x2 + B11x12 +…
In contrast, chemistry offers unique challenges to the team of experimenter and statistician. Chemistry is a science replete with nonlinearities, complex interactions, and nonquantitative factors and responses. Chemical experiments require more forethought and better planning than most DOE’s. Chemistry-specific elements must be considered.
Mixtures
Above all, chemists make mixtures of ‘stuff’. These may be catalysts, drugs, personal care items, petrochemicals, or others. A beginner trying to apply DOE to a mixture system may think to start with a conventional cubic factorial design. It soon becomes clear, however, that there is an impossible situation when the (+1, +1, +1) corner requires 100% of A and B and C! The actual experimental space of a mixture is a triangular simplex. This can be rotated into the plane to show a simplex design, and it can easily be extended to high dimensions such as a tetrahedron.
It is rare that a real mixture experiment will actually use 100% of the components as points. A real experiment with be constrained by upper and lower bounds, or by proportionality requirements. The active ingredients may also be tiny amounts in a solvent. The response to a mixture may be a function of the amount used (fertilizers or insecticides, for example). And the conditions of the process which the mixture is used in may also be important, as in baking a cake – or optimizing a pharmaceutical reaction. All of these will require special designs.
Fortunately, all of these simple and complex mixture designs have been extensively studied and are covered by Cornell3, Anderson et al4, and Design-Expert® software.
Kinetics
The goal of a kinetics study is an equation which describes the progress of the reaction. The fundamental reality of chemical kinetics is
Rate = f(concentrations, temperature).
However, the form of the equation is highly dependent on the details of the reaction mechanism! The very simplest reaction has the first-order form
Rate = k*C1
which is easily treated by regression. The next most complex reaction has the form
Rate = k*C1*C2
in which the critical factors are multiplied – no longer the additive form of a typical linear model. The complexity continues to increase with multistep reactions.
Catalysis studies are chemical kinetics taken to the highest degree of complication! In industry, catalysts are often improved over years or decades. This process frequently results in increasingly complex catalyst formulations with components which interact in increasingly complex ways. A basic catalyst may have as many as five active co-catalysts. We now find multiple 2-factor interactions pointing to 3-factor interactions. As the catalyst is further refined, the Law of Diminishing Returns sets in. As you get closer to the theoretical limit – any improvement disappears in the noise!
Chemicals are not Numbers
As we look at the actual chemicals which may appear as factors in our experiments, we often find numbers appearing as part of their names. Often the only difference among these molecules is the length of the chain (C-12, 14, 16, 18) and it is tempting to incorporate this as numeric levels of the factor. Actually, this is a qualitative factor; calling it numeric invites serious error! The correct description, now available in Design-Expert, is ’Discrete Numeric’.
The real message, however, is that the experimenters must never take off their ’chemist hat‘ when putting on a ’statistics hat’!
Reference Materials:
- Leardi, R., "Experimental design in chemistry: A tutorial." Anal Chim Acta 2009, 652 (1-2), 161-72.
- Box, G. E. P.; Hunter, J. S.; Hunter, W. G., Statistics for Experimenters. 2nd ed.; Wiley-Interscience: Hoboken, NJ, 2005.
- Cornell, J. A., Experiments with Mixtures. 3rd ed.; John Wiley and Sons: New York, 2002.
- Anderson, M.J.; Whitcomb, P.J.; Bezener, M.A.; Formulation Simplified; Routledge: New York, 2018.